MillaBot — Academy Manual
A step-by-step handbook for trading the MillaBot system. Same rules for the Indicator and Strategy — the only difference is execution.
Indicator vs Strategy
- MillaBot Indicator: prints BUY/SELL alerts + stop/target lines. You place trades manually.
- MillaBot Strategy: uses the same logic, but it can submit orders automatically.
Core idea
Zone Retest = Setup
Reversal Line = Step 2
Trend Flip (Dot) = Trigger
Without the Reversal Line, the Dot is not allowed to trigger a trade.
Table of Contents
- Quick Start
- The 3-Step Flow (Setup → Step 2 → Trigger)
- Zones & Retests (How the Setup forms)
- Reversal Line (Step 2 Confirmation)
- Trend Flip Dot (The Only Trigger)
- Stop/Target Management (Dynamic Risk)
- AutoExit (Only 2 Exit Rules)
- Modes (Autopilot, Track, Sport, Comfort, Eco)
- HUB & Toggle (On-chart controls & readouts)
- Execution Guide (Indicator & Strategy)
- Screenshot Walkthroughs (Insert Images)
- FAQ & Troubleshooting
- Money Management
1) Quick Start
Chart setup
- Load MillaBot (Indicator or Strategy) on your preferred instrument.
- Keep Selected Mode on Autopilot (default) unless you intentionally want manual mode.
- Enable Zones + Retest marks so you can see the setup forming.
What to wait for (always in order)
- Zone Retest happens (setup forms at a demand/supply zone).
- Reversal Line appears (direction confirmation).
- Dot prints (trend flip trigger). This is the entry trigger.
2) The 3-Step Flow
Step 1 — Zone Retest (Setup)
A candle (or candles) test a zone and confirm a retest. The system will mark the retest (e.g., with an X on the retest candle).
Step 2 — Reversal Line
A Reversal Line must print around the zone area in the same direction as the retest bias. This is the mandatory confirmation.
Step 3 — Trend Flip Dot (Trigger)
The Dot is the trigger. When the Dot prints after the Reversal Line (and aligns with trend rules), the system fires the entry (Indicator alert or Strategy order).
3) Zones & Retests (How the Setup forms)
MillaBot draws zones (demand/support and supply/resistance). A retest is when price returns to test the zone boundary or the zone box.
Valid retest (what the code treats as “retest”)
- Wick or body touches the zone area.
- If the wick retests and the candle closes outside of the zone, it still counts as a retest (and should still mark the X).
- Zones are filtered by Min Zone Score so weak zones can be ignored.
- Higher scores mean fewer zones (cleaner, stronger reactions), lower scores mean more zones (more signals, more noise).
4) Reversal Line (Step 2 Confirmation)
The Reversal Line is your mandatory confirmation after a zone retest. It must appear as part of the system’s reversal detection and align with the retest direction.
- Bullish case: Reversal Line prints in a bullish direction near/inside/around the demand zone area.
- Bearish case: Reversal Line prints in a bearish direction near/inside/around the supply zone area.
- This step is not optional — without it, the Dot trigger is blocked.
5) Trend Flip Dot (The Only Trigger)
The Dot is your trend flip confirmation and the trigger for entry.
- Bull Dot = trend flips bullish (entry trigger for long only if Step 1 and Step 2 are already valid).
- Bear Dot = trend flips bearish (entry trigger for short under the same rule).
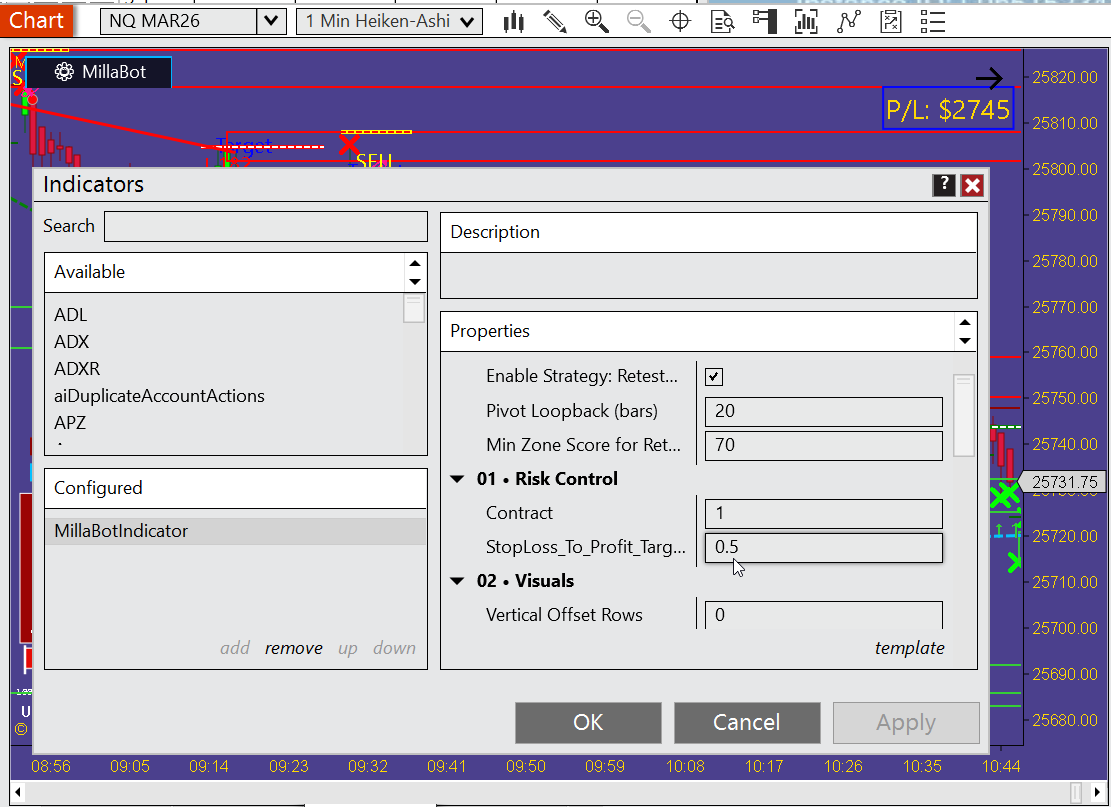
6) Stop/Target Management (Dynamic Risk)
Targets are not static. They are computed from the system’s dynamic stop and your ratio setting.
Stop placement (dynamic)
- Long trades: stop is placed using the zone-based risk logic (stop below the demand structure the system selected).
- Short trades: stop is placed above the supply structure the system selected.
Target placement (ratio based)
Target is computed from the stop distance using:
StopLoss_To_Profit_Target_Ratio (default 0.5)
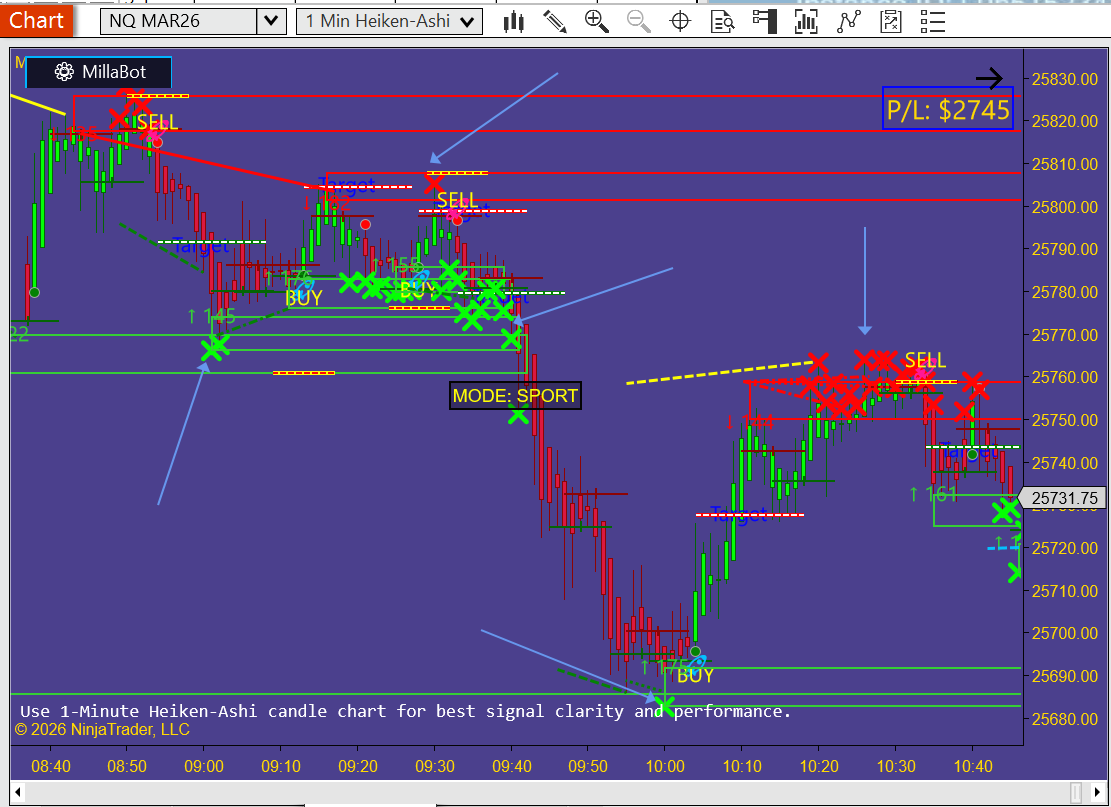
What you see on the chart
- A labeled entry (BUY / SELL)
- A stop line
- A target line
7) AutoExit (Only 2 Exit Rules)
AutoExit in your code is strictly based on two reversal-style exits:
- Opposite Dot (trend flips against your position)
- Opposite Zone Retest (a retest forms against your position)
- The Reversal Line (detects when momentum weakens)
8) Modes (Autopilot, Track, Sport, Comfort, Eco)
Autopilot (default)
Autopilot is the default mode and automatically selects the best behavior based on market speed (fast/slow conditions). You do not have to guess — the system adapts.
Manual modes
- Track: tightest/fastest behavior for aggressive movement.
- Sport: fast market, but not maximum strictness.
- Comfort: balanced conditions.
- Eco: calmer market conditions.
9) HUB & Toggle
The HUB
The HUB is your on-chart dashboard. When enabled (Show Hub), it displays live system context (trend/heat/bias style metrics), so you can understand why the system is allowing or blocking entries.
- Shows current mode (and Autopilot’s selected mode when Autopilot is active).
- Shows strength meters (bull vs bear pressure), and other context fields the system calculates.
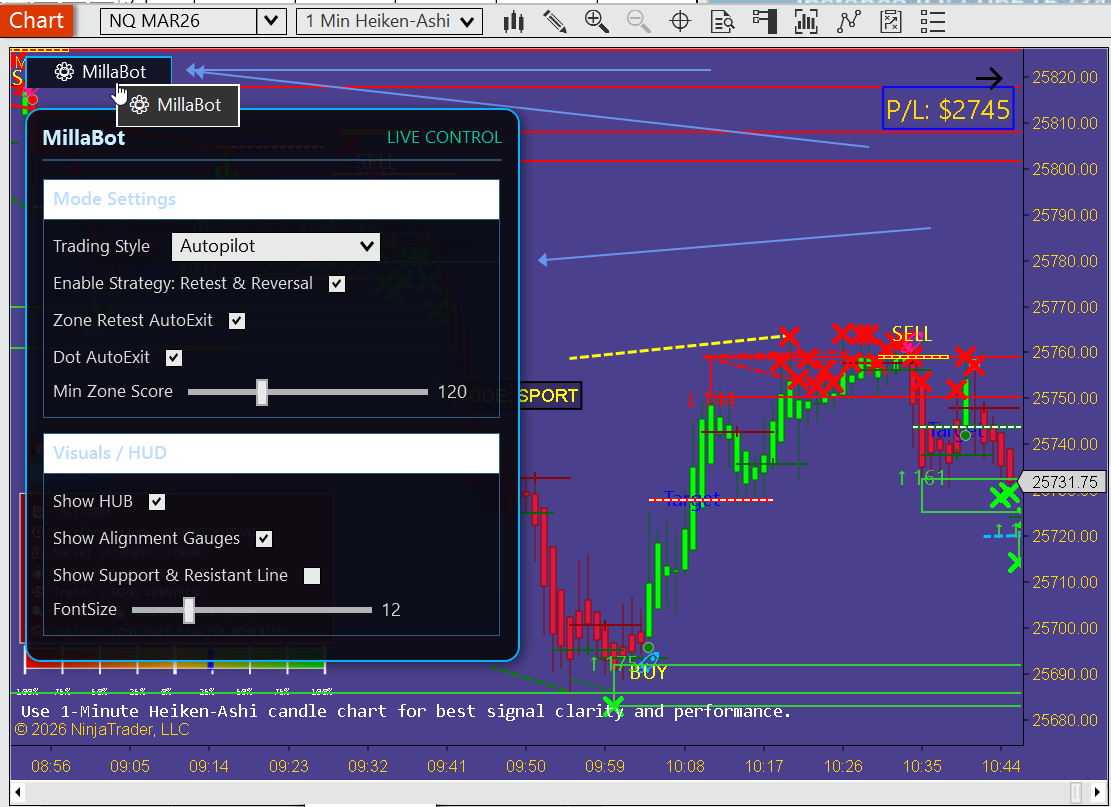
The Toggle
The Toggle is the quick on-chart control to enable/disable visual elements and quick settings without digging through the properties window.
- Use it to reduce clutter (turn off extra drawings) during live trading.
- Use it to quickly confirm what mode you’re in and what the system is evaluating.
10) Execution Guide
Indicator execution (manual trading)
- Wait for Zone Retest setup.
- Wait for Reversal Line confirmation.
- Enter on the Dot trigger (trend flip).
- Use the printed stop and target lines to place your orders.
- Exit only by the AutoExit rules (opposite Dot or opposite zone retest) unless you have your own rules.
Strategy execution (automated trading)
- The Strategy uses the same 3-step logic.
- When triggered, it submits the order and applies the system stop and ratio-based target.
- AutoExit can manage exits using the two rule set (opposite Dot, opposite zone retest).
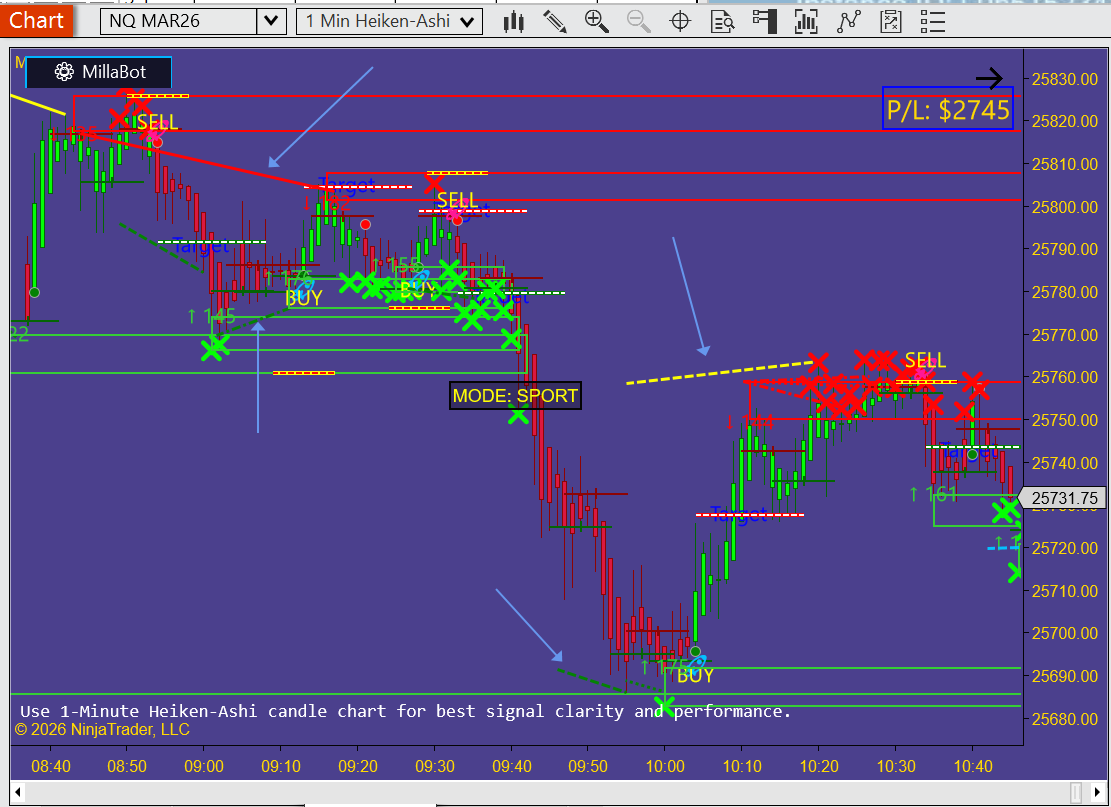
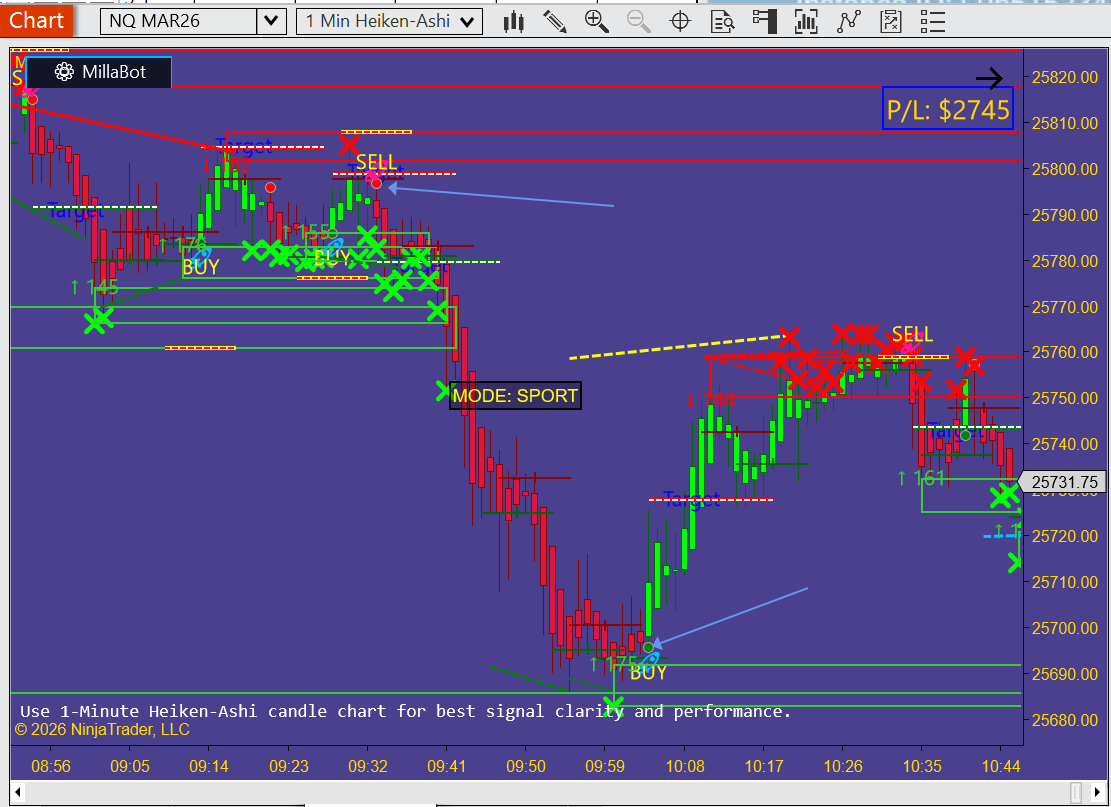
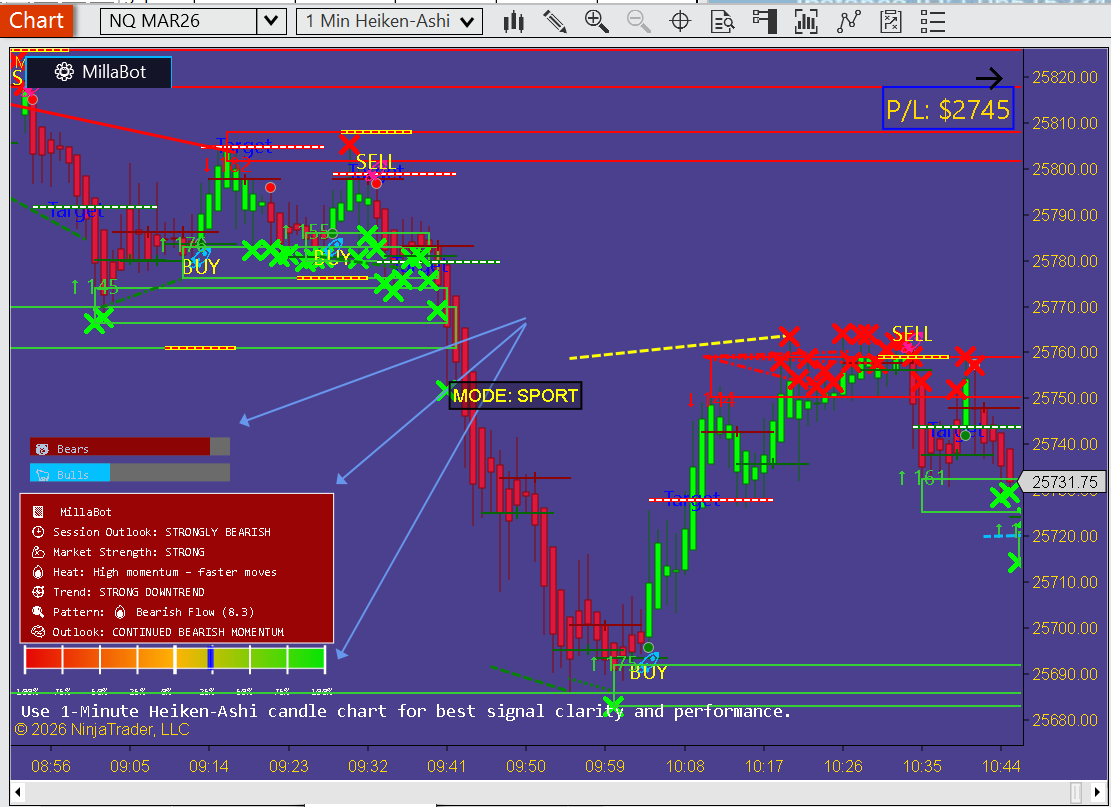
11) Screenshot Walkthroughs
MillaBot screenshots
12) FAQ & Troubleshooting
“I see a Dot but no trade/alert.”
That is expected if the Reversal Line (Step 2) did not occur after a valid Zone Retest (Step 1). Dot is blocked without Step 2.
“Why did the system skip a zone?”
Most of the time it is the Min Zone Score filter or mode requirements. Raise or lower the score threshold and review the HUB to see what is failing.
“What should I set for the ratio?”
Default is 0.5. Higher ratio = bigger targets. Lower ratio = quicker targets. Start with default until you have enough data.
13)📊 Money Management Module
The Money Management Module is the risk-control engine of MillaBotPRO. It protects your capital, controls losses, locks profits and automatically adapts to changing market conditions — without emotional decision-making.
1️⃣ Daily Max Drawdown
This setting defines the maximum dollar amount you are willing to lose in a single trading day.
- If your total losses reach this value, trading stops for the day
- Prevents revenge trading and account blow-ups
- Recommended: 1–3% of your account size
2️⃣ Recovery Attempts
Recovery Attempts split your Daily Max Drawdown into controlled risk portions.
Example:
Daily Max Drawdown = $750
Recovery Attempts = 3
Risk per attempt = $250
Each time price moves against you by this amount, an attempt is counted. Once all attempts are used, trading stops.
3️⃣ Active Stop Logic (Very Important)
MillaBotPRO always uses the lowest risk stop available:
- Zone-based stop (technical stop)
- Money Management stop (risk-based stop)
Whichever stop is closer to entry is used. This guarantees minimum risk per trade.
4️⃣ Trailing Engine
The Trailing Engine protects profits automatically once price moves in your favor.
Trailing Modes
- Conservative – Protect early, reduce giveback
- Balanced – Confirm move, then trail
- Aggressive – Let winners run, widest trail
Trailing Trigger & Step
Trailing is activated after price moves a defined number of ticks in your favor.
The HUD shows:
- Trigger distance (ticks + dollar value)
- Trailing step (ticks + dollar value)
- Live trailing state: Waiting / Active
5️⃣ Profit Lock
Profit Lock protects a percentage of your current profit, not the highest profit of the day.
Example:
Current PnL = $1500
Profit Lock = 80%
Protected amount = $1200
If profit drops below this level, trading stops.
6️⃣ Daily Max Profit
Once your daily profit target is reached, the system stops trading. This prevents giving profits back during choppy or reversing markets.
7️⃣ Live HUD Awareness
The HUD displays real-time status:
- Money Management state (Active / Halted)
- Remaining daily risk
- Recovery attempts used
- Trailing engine state
- Profit protection levels
This gives traders full transparency and confidence at all times.